Here is why (using an extract of our recommended portfolio):
Step -1 — Decide your medium term (3 to 5 yrs) outlook for equity markets. Ours has been positive for last 5 years. Did it go right? Yes! (See chart below Step-2)
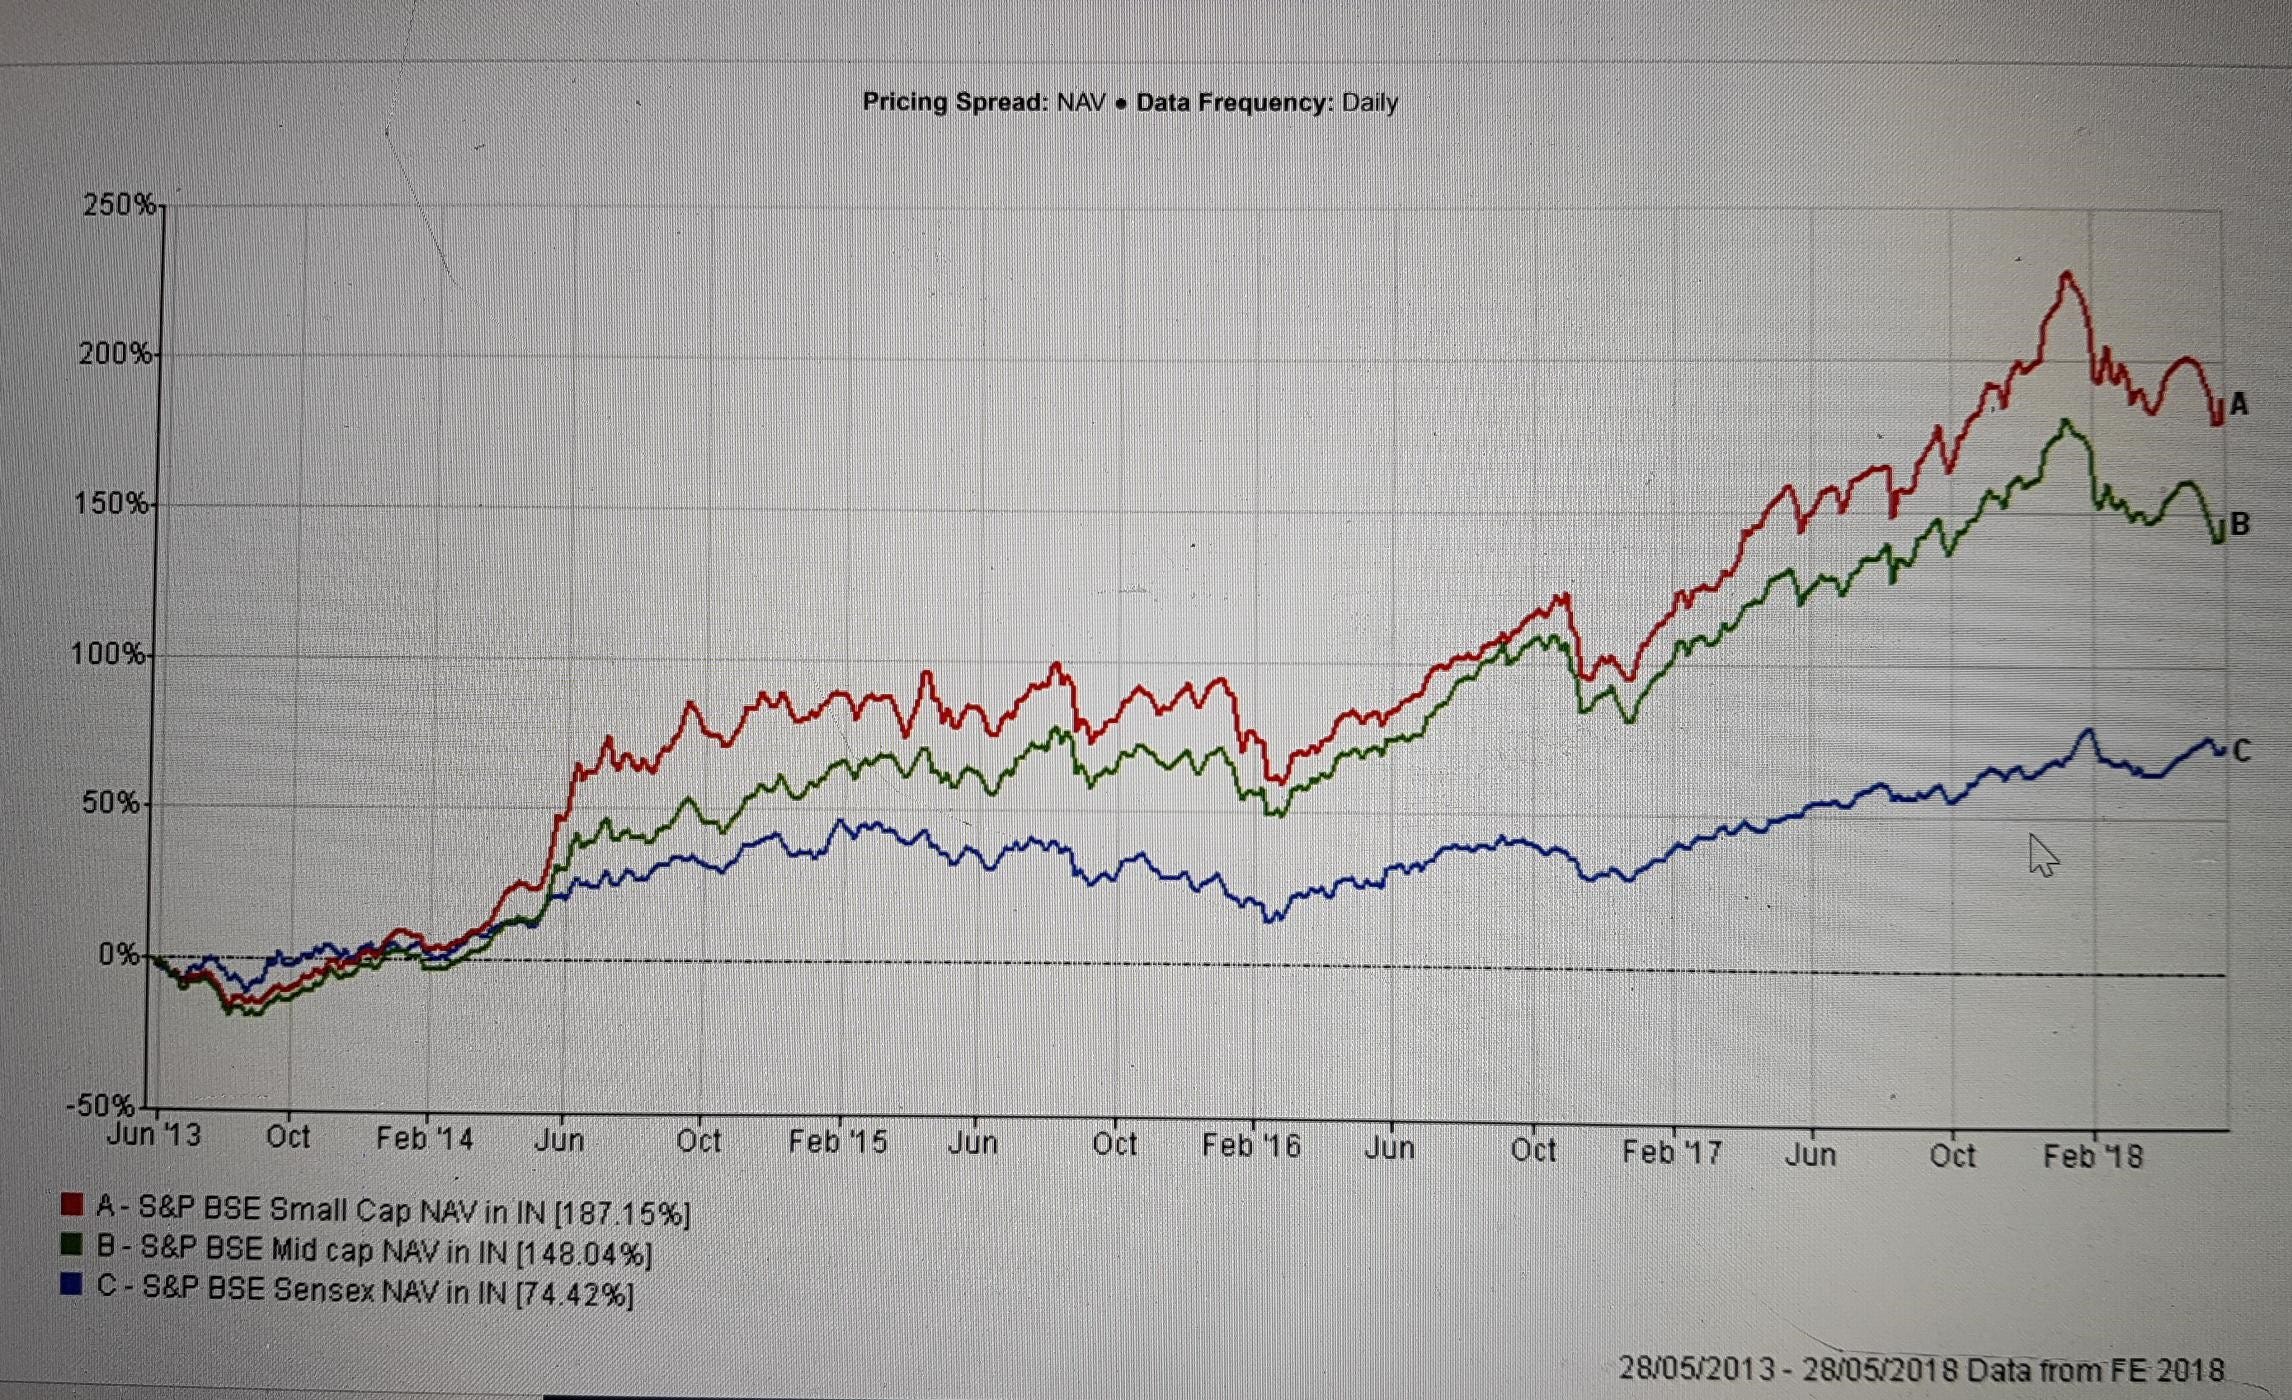
Step — 2 — Based on our bullish outlook (step-1), we tilt the equity portfolio traits to certain pockets in scientific ways. e.g. In a bullish phase we advise that mid-caps would usually do better than large-caps. So we overweight our portfolios toward mid-caps relative to the market (but not too much). Compared to about 68–70% of equity market being occupied by large-caps, our equity portfolios have lower allocation to large-caps (~55% to 65% in large-caps)
Has this approach yielded positive results? Handsomely! (See chart below where mid caps have outperformed large-caps)
5 year performance comparison — Large Vs Mid Vs Small Cap Indices
How does this relate to and justify last one year under-performance of equity portfolios?
So, yes we did the right thing by tilting away from large-caps to attain this medium term out-performance depicted in the chart above, but there are bouts of short-term pain that our clients have digested for achieving such superior results.
The current 4-month dip, which started in Jan ’18 end (and still continues), is one such period. Obviously the trigger for this particular dip was imposition of taxes by the government on long-term capital gains of equity oriented investments.
Taking cue from step-1, in a sliding equity market scenario, reverse holds true i.e. mid-caps should under-perform large-caps. Did it happen? Yes again (see below chart).
As we stand today (ending May ‘18) large-cap is almost at par compared to it’s high in Jan ’18 end, but mid/small cap are still about 12% absolute negative. This blow has actually caused large-caps to outperform over the entire last 1 year performance period. (and not only the last 4 month performance)
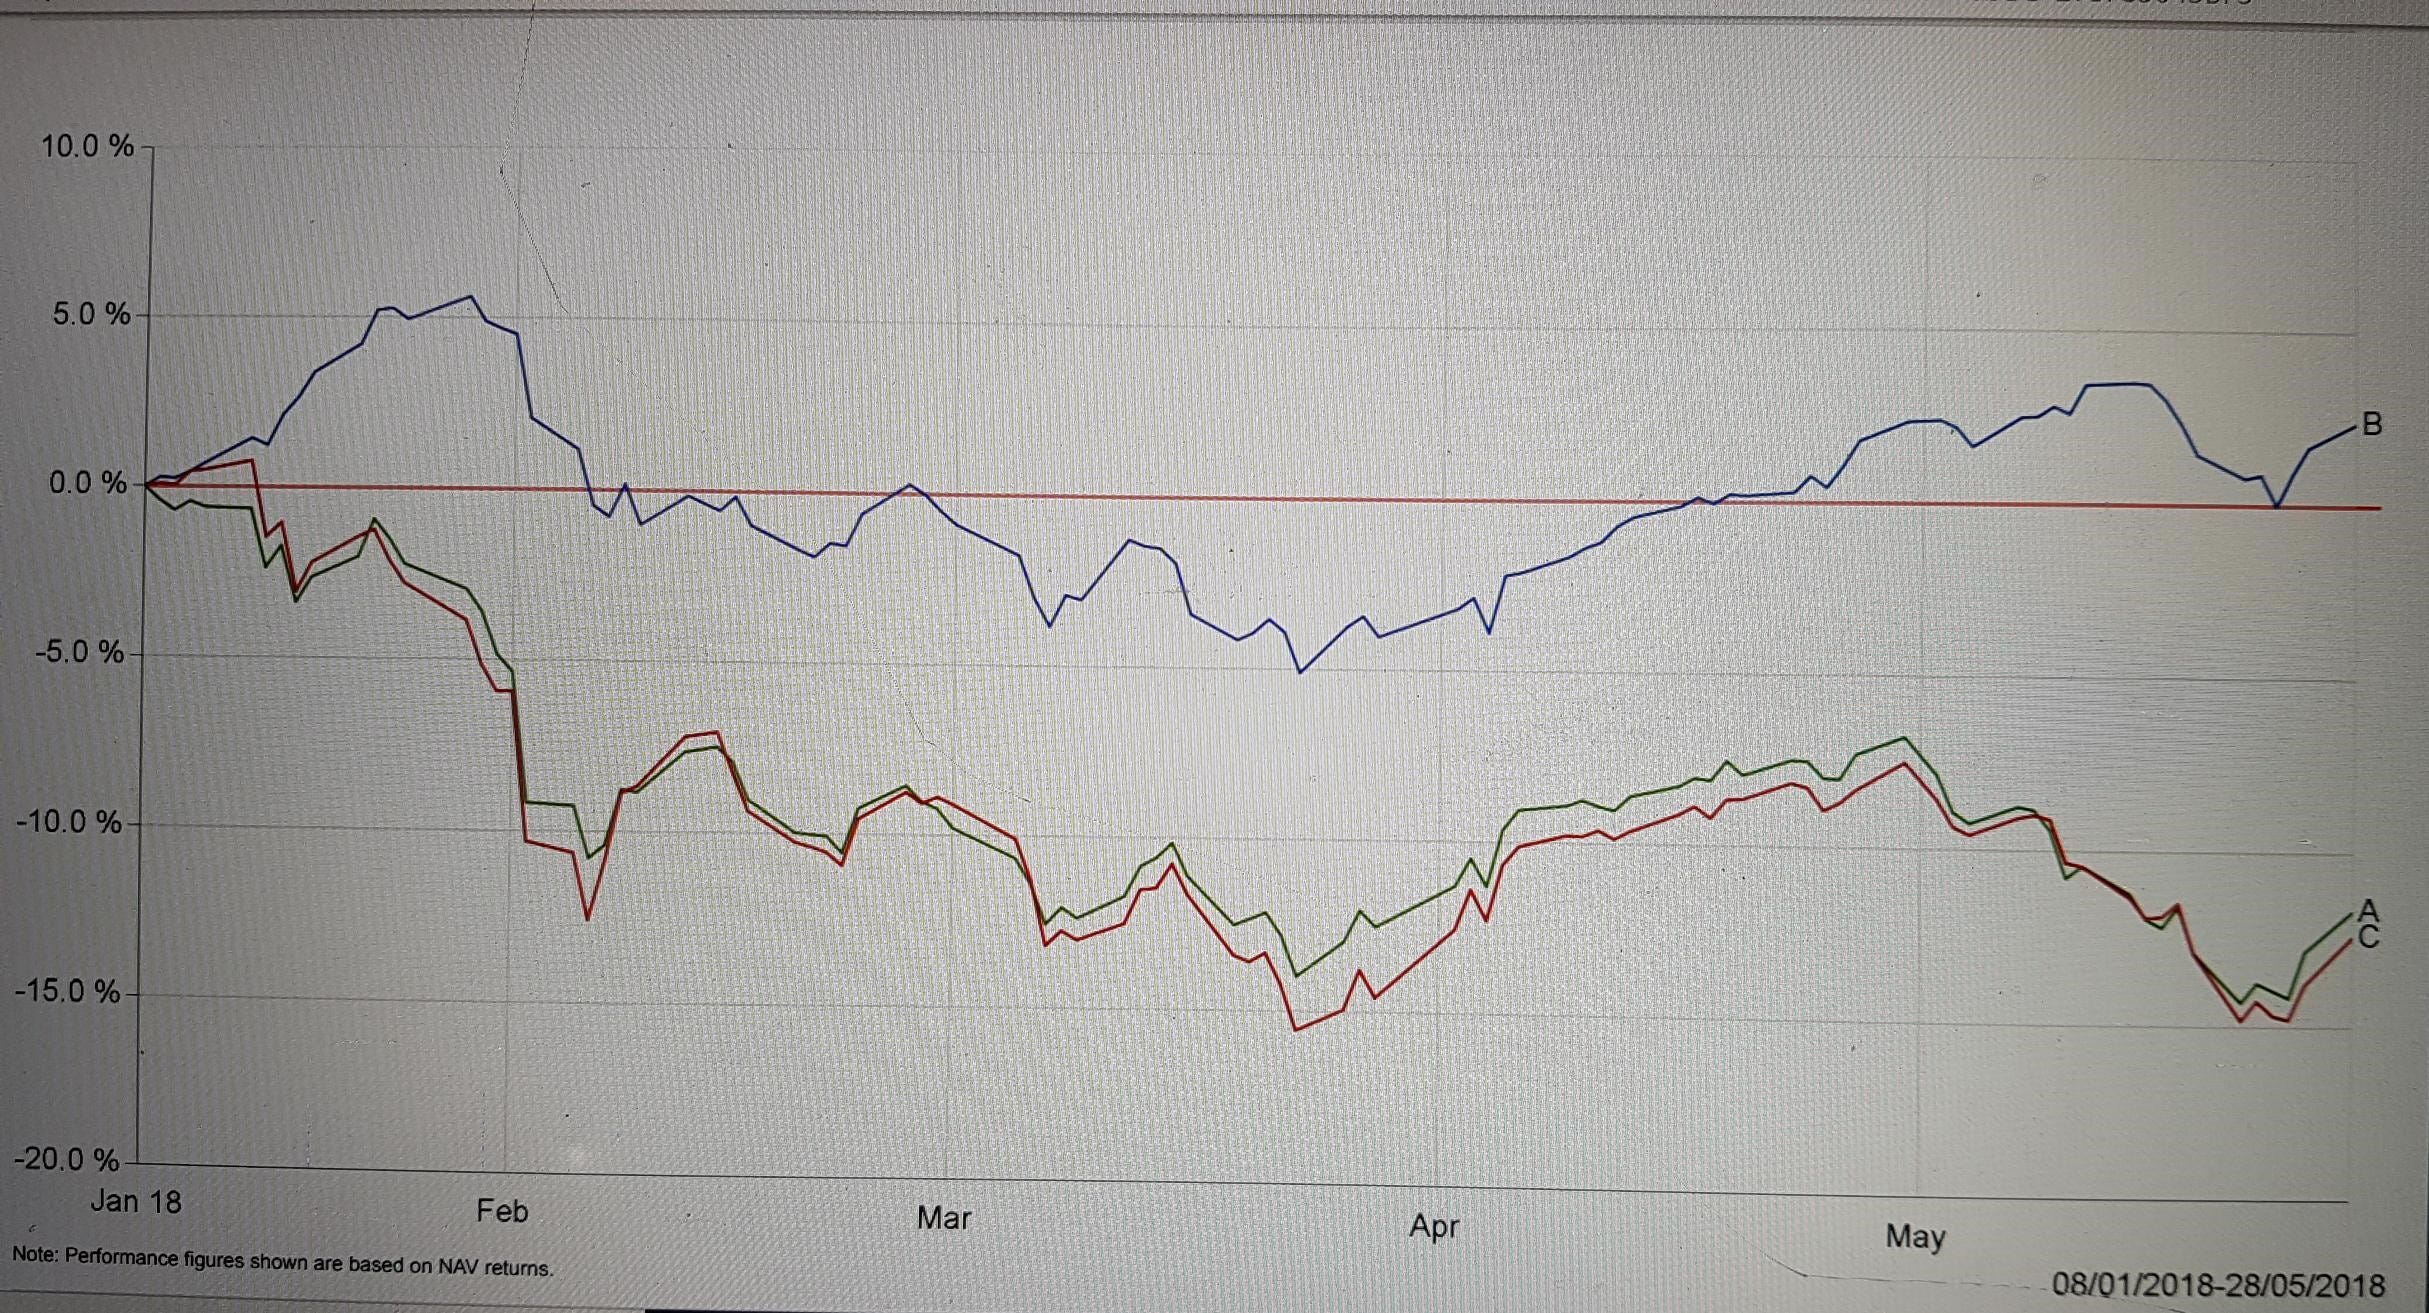
So portfolios like ours, which are by design cautiously over-weight on mid-caps, should under-perform by definition.
But to achieve a more robust out-performance over a 5 year period, such 4 (or even more) months of under-performance is the price we have to be willing to cough up. (See chart 1 and 2 together)
Think of it as a strategy to win a marathon. You don’t need to be the fastest runner in every lap to win a marathon.
To conclude, if any new equity portfolio is outperforming in the last one year it calls for investigation! Is it due to too much concentration risk? Is it constructed on the basis of a negative equity market outlook?