
Slipping Equity Markets. Should you act? Our View.
Equity investors have been going through a tough phase for almost 1.5 years now. Since the time capital gains tax on equity was re-introduced in Jan ‘18.
While the equity markets have been yo-yoing since then ( it fell by ≈ 14% in Aug-Oct ’18; then rose by ≈ 20%; the current market skid is different as it is weighing very heavily, even on the minds of most seasoned wealth owners and advisors.
What is causing the sentiment to turn so bearish as the current slide, standing at ≈ 9%, is still much lesser than the previous slide ≈ 14% in Aug last year?
We feel the key reason is that for the first time in many years economic indicators are pointing to a slowdown of the Indian economic machinery. Of course, media is playing its role very well and hence I will not expound the sentiment by reproducing the list of such indicators.
Our view:
The stems of stress and panic had entwined our minds also and, admittedly, we are still not completely out of the woods. Taking Tony Robbin’s advice, that the only antidote to fear and stress is massive action, we got down to doing exactly that — Talking to fund managers, attending seminars, meeting different market participants, evaluating what the economists had to say, examining the longer term data etc.
The net result of activity can be summed up as — every time recent developments and news take a toll on investor sentiment, one should get back to reading financial history. It helped us zoom out and make our allocations more objectively.
Warren Buffet put it differently when he advised to lock yourself away in a room and think objectively.
Post the discussion, we have communicated recommended portfolio actions to our clients. Broadly, the advice is to stay the course in most cases.
Some of the things we considered:
- Asset Allocation changes — We reminded ourselves the promise of long-band reallocation only. i.e. The only time we will give a call to reduce equity in a major way is when we believe we are at the peak. When everything is firing in all cylinders. Markets. Economy. May be once in 10 years
- The correlation between economic cycle and capital market cycle is not 1. What it means is that even though the economy may continue to slide, markets may actually behave differently and can even go up. In other words, while we feel that the economy will take a couple of quarters to change gears, we can’t predict the market movement in short-term
- J-curve Effect — We believe that a lot of reforms instituted by the Modi government are having a J-curve effect, especially in the context of Indian business. As per the theory, initially there is a setback in response to a fundamental change but as time passes the results bounce back better than ever before. Think of it as your parents forcing you to quit on your girlfriend. You are upset and in a visibly bad shape. And after a few months you get married to Alia Bhatt! That’s the effect GST, for example, must have on the economy!
- Manthan — A very experienced fund manager pointed out a fundamental thing we missed. While the economic growth is clearly in a slowdown mode, there is an opposing force in the form of enabling macro-economic environment. Low inflation, low interest rate and benign fiscal deficit. All these contribute in helping the economic machinery move faster. Currently, there is no clear-cut winner, but the forces are equally potent on both sides
- Credit growth — This indicator has the highest weightage in our analysis. Thankfully, this number is still growing in healthy double digits. Credit / loans have a multiplier effect on the economy. e.g. a loan of 100 bucks can actually have a positive consumption impact of 1000 bucks on an economy
- Equity Valuations — The valuations have corrected significantly in the last few months. Most of the stocks are trading below or near their long-term average valuation parameters
- Staying invested itself is an established strategy which has given handsome returns. Peter Lynch supports this when he says “You get recessions, you have stock market declines. If you don’t understand that’s going to happen, then you’re not ready, you won’t do well in the markets.”
However, it is one of the most difficult things to do. Key role of advisers is to hand hold their clients through this tough phase. Possibly, this is the kind of times when 10% of investors are able to ignore the pain and come out successful.

Your equity portfolio has under-performed in the last year? That’s good news!
Here is why (using an extract of our recommended portfolio):
Step -1 — Decide your medium term (3 to 5 yrs) outlook for equity markets. Ours has been positive for last 5 years. Did it go right? Yes! (See chart below Step-2)
Step — 2 — Based on our bullish outlook (step-1), we tilt the equity portfolio traits to certain pockets in scientific ways. e.g. In a bullish phase we advise that mid-caps would usually do better than large-caps. So we overweight our portfolios toward mid-caps relative to the market (but not too much). Compared to about 68–70% of equity market being occupied by large-caps, our equity portfolios have lower allocation to large-caps (~55% to 65% in large-caps)
Has this approach yielded positive results? Handsomely! (See chart below where mid caps have outperformed large-caps)
5 year performance comparison — Large Vs Mid Vs Small Cap Indices
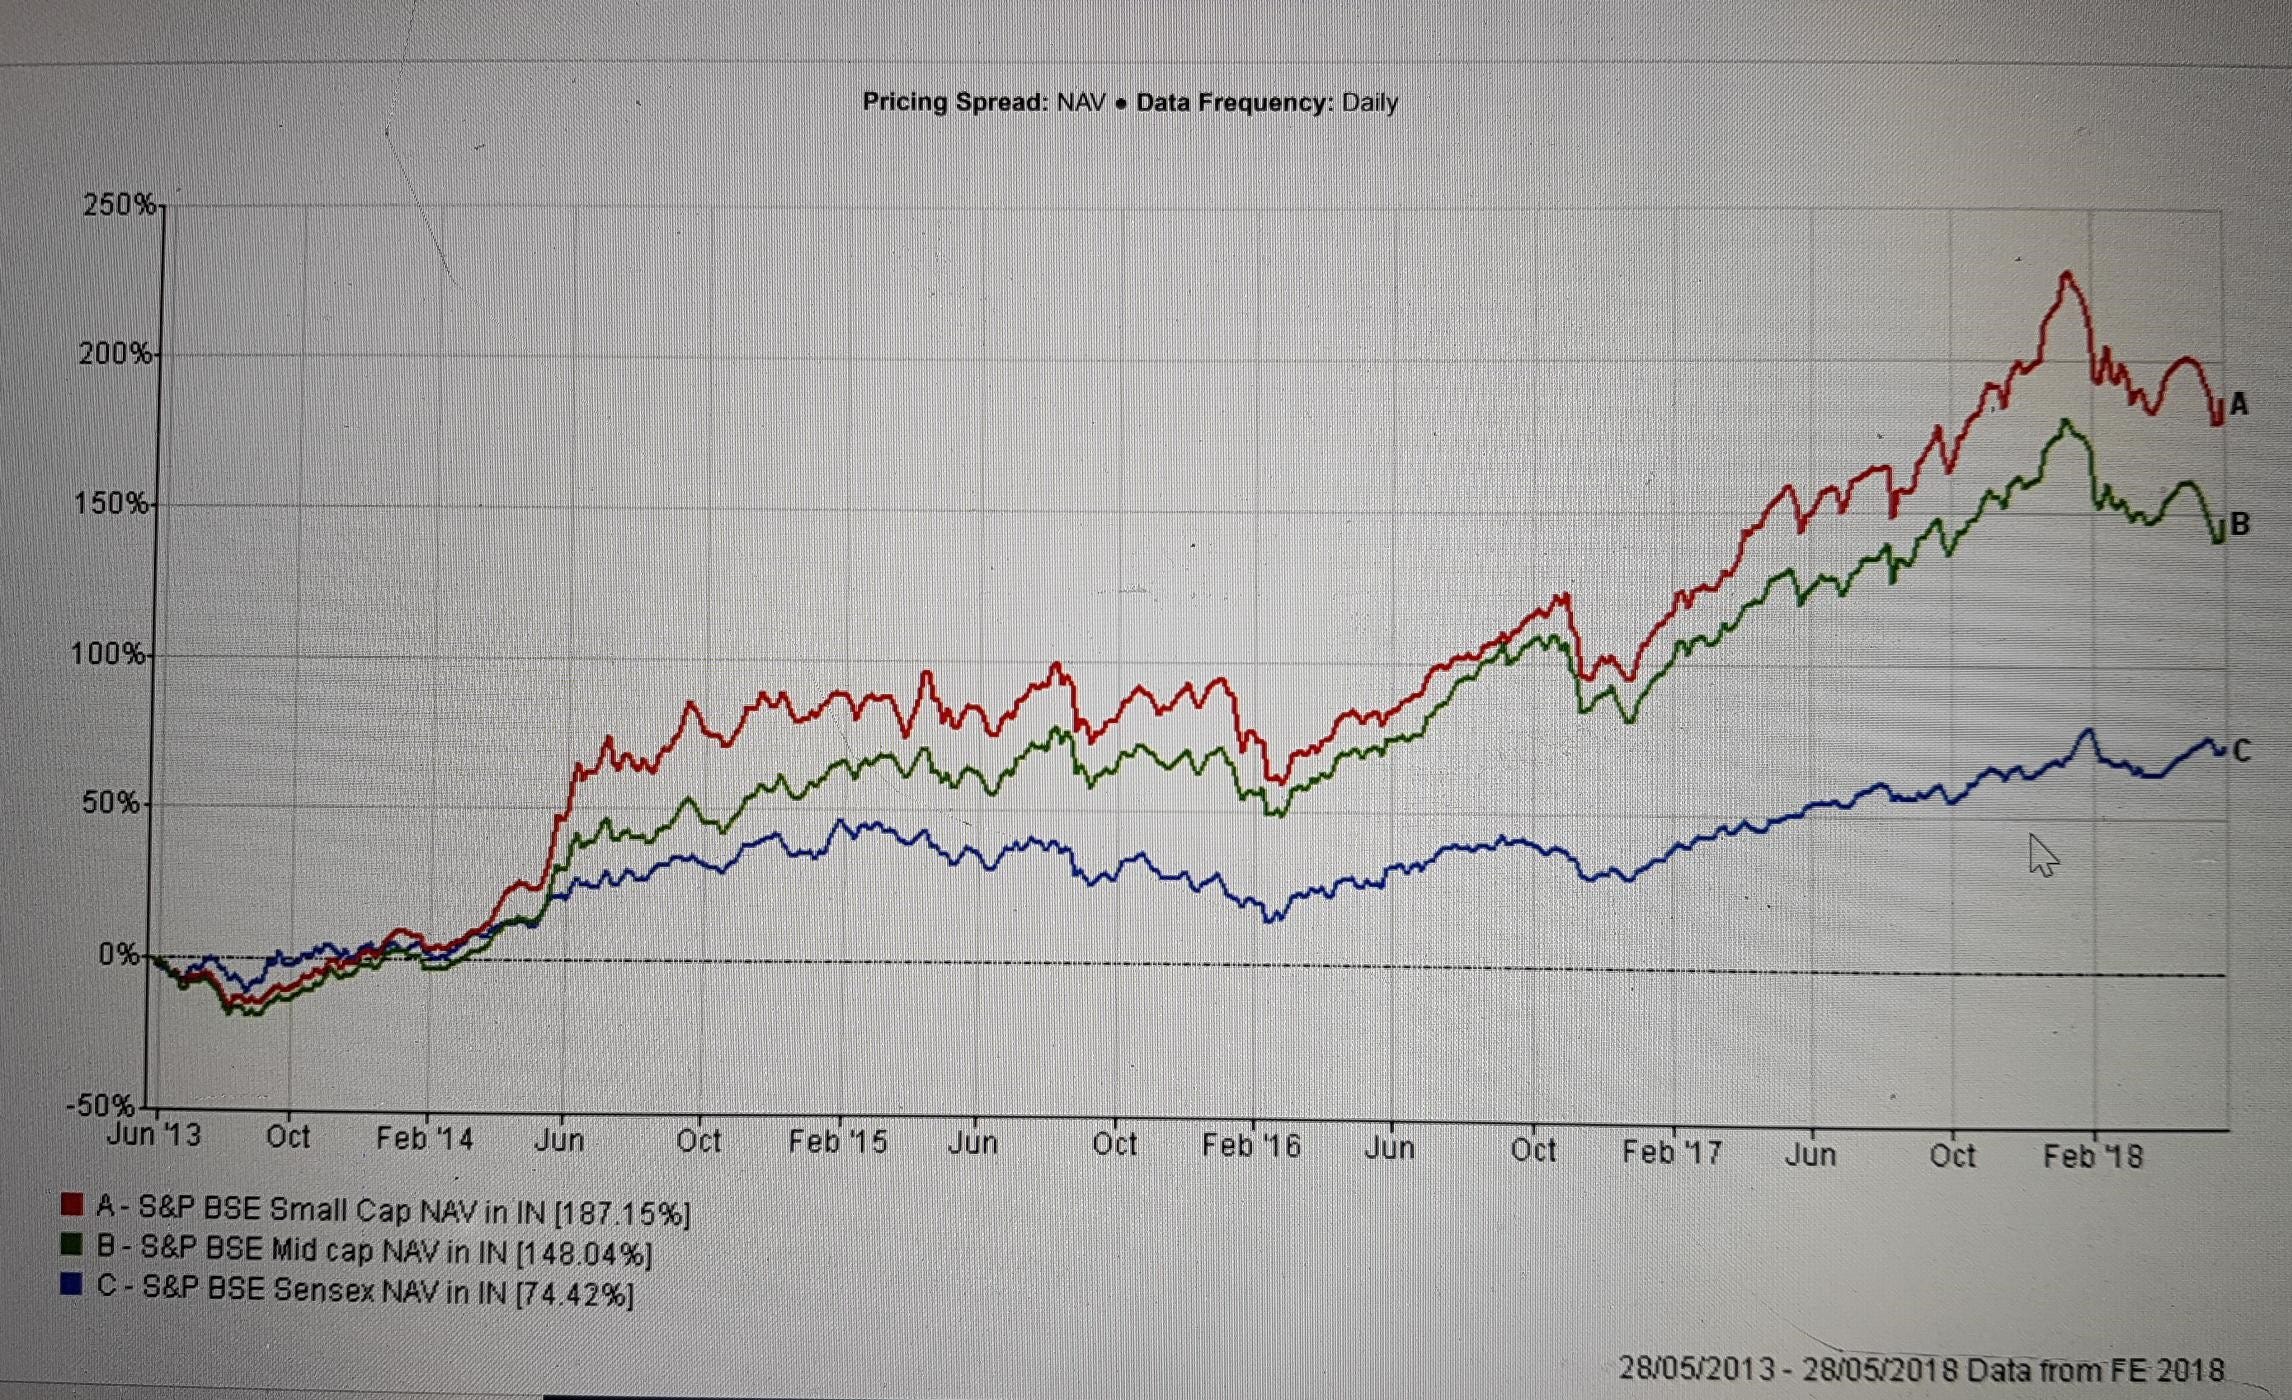
How does this relate to and justify last one year under-performance of equity portfolios?
So, yes we did the right thing by tilting away from large-caps to attain this medium term out-performance depicted in the chart above, but there are bouts of short-term pain that our clients have digested for achieving such superior results.
The current 4-month dip, which started in Jan ’18 end (and still continues), is one such period. Obviously the trigger for this particular dip was imposition of taxes by the government on long-term capital gains of equity oriented investments.
Taking cue from step-1, in a sliding equity market scenario, reverse holds true i.e. mid-caps should under-perform large-caps. Did it happen? Yes again (see below chart).
As we stand today (ending May ‘18) large-cap is almost at par compared to it’s high in Jan ’18 end, but mid/small cap are still about 12% absolute negative. This blow has actually caused large-caps to outperform over the entire last 1 year performance period. (and not only the last 4 month performance)
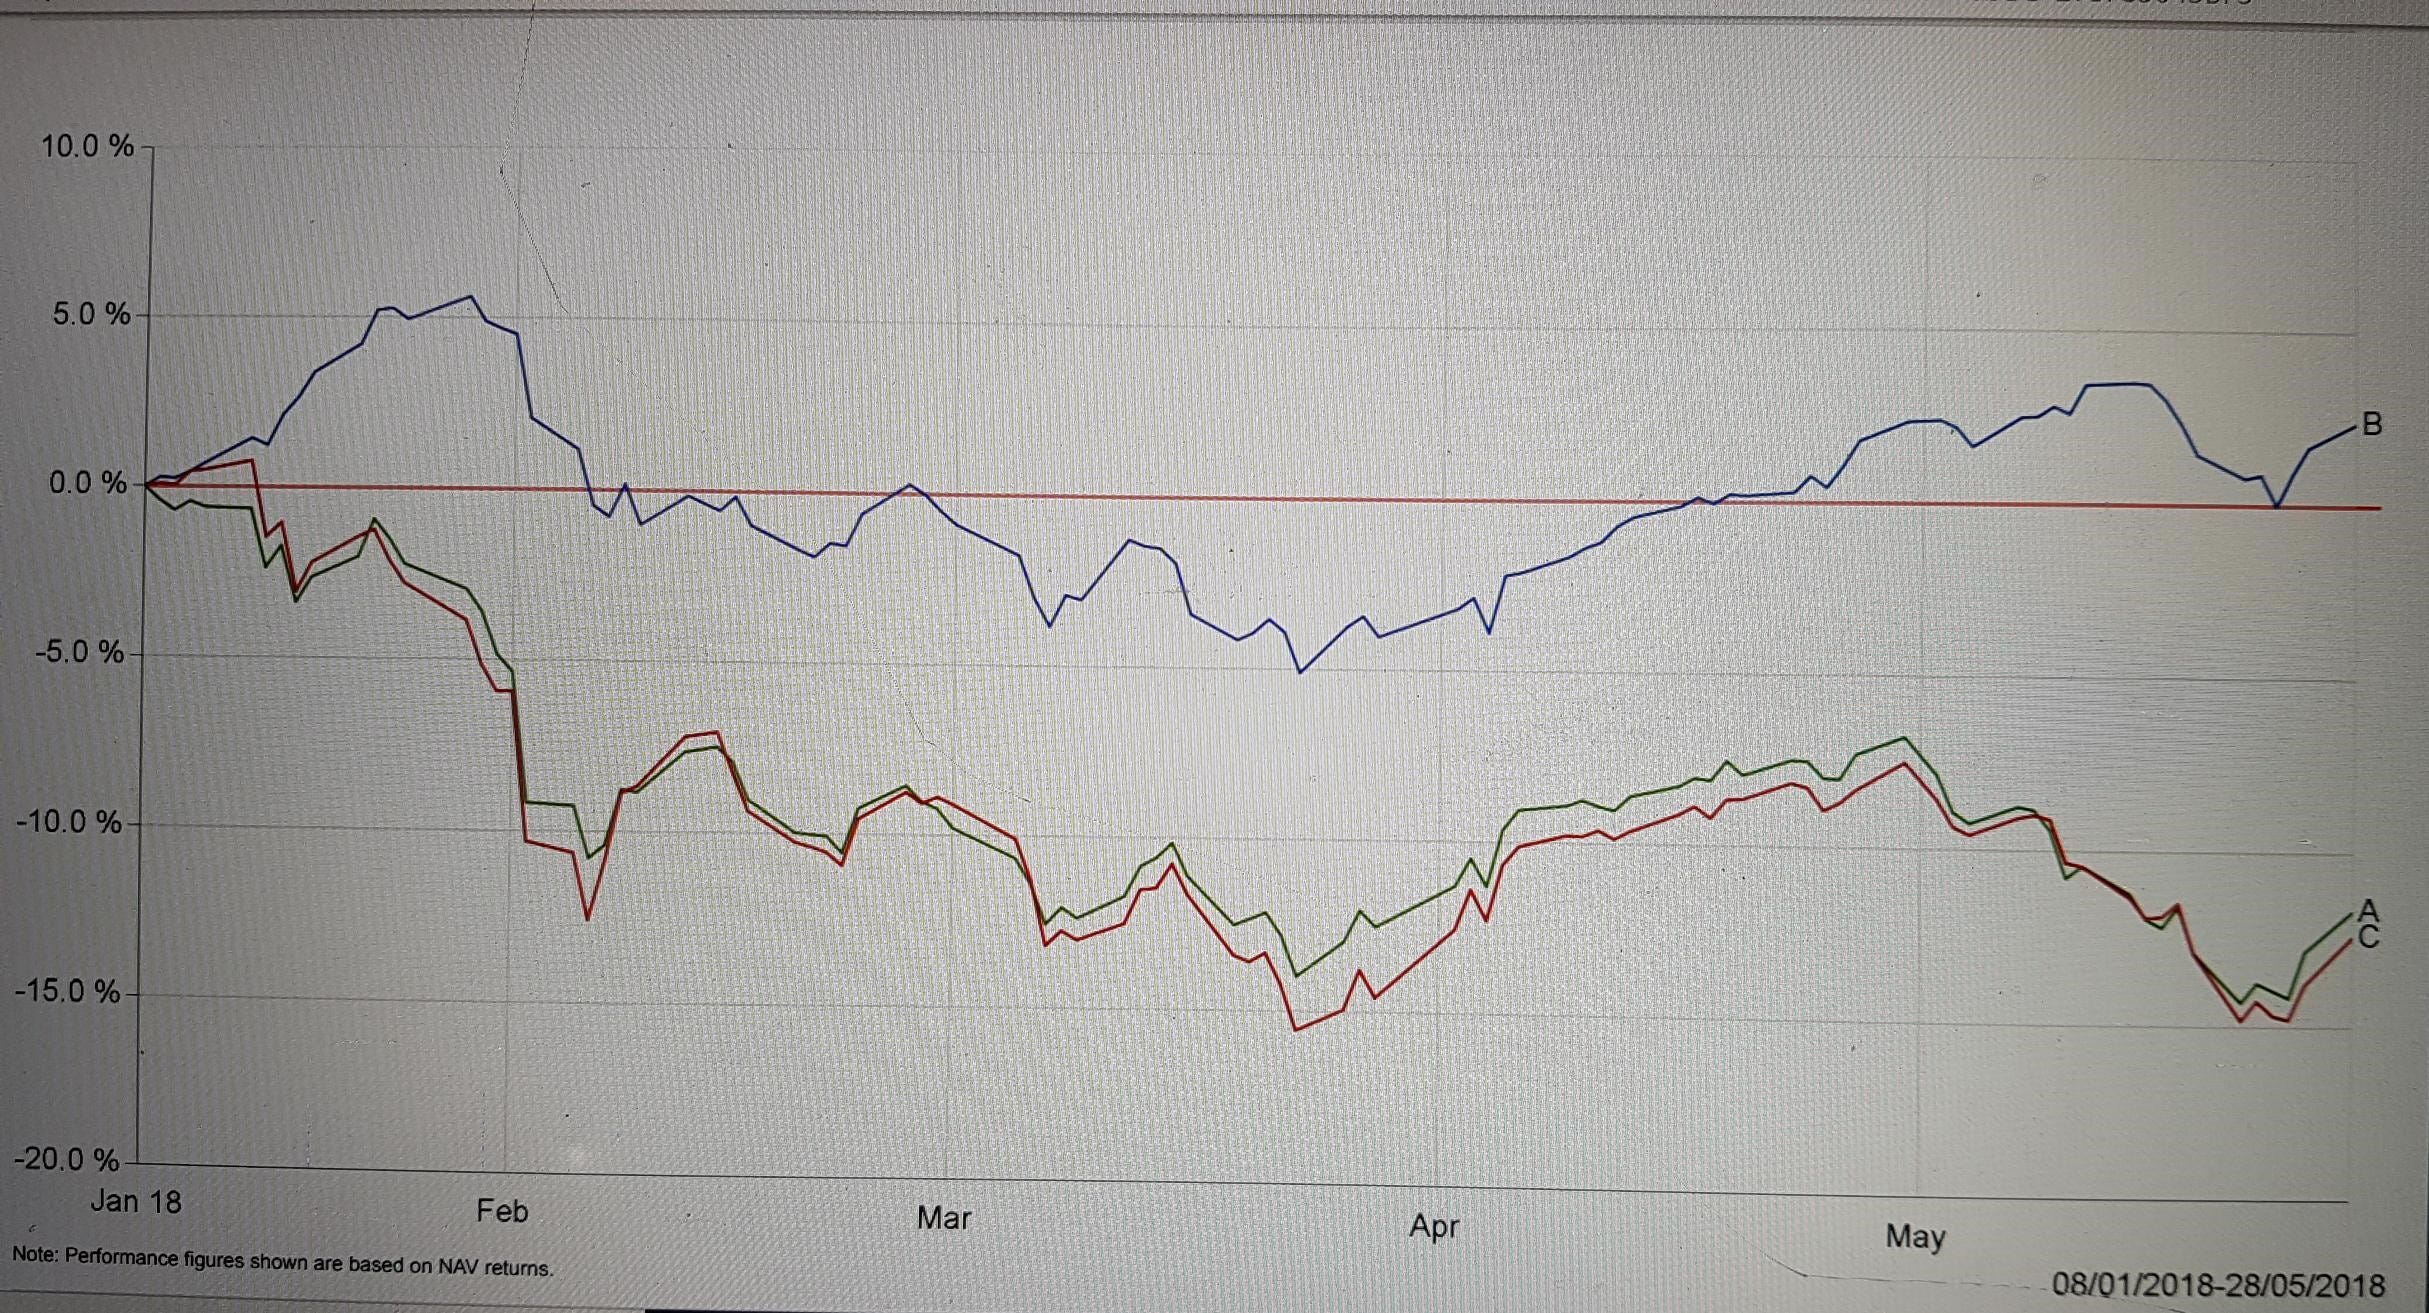
So portfolios like ours, which are by design cautiously over-weight on mid-caps, should under-perform by definition.
But to achieve a more robust out-performance over a 5 year period, such 4 (or even more) months of under-performance is the price we have to be willing to cough up. (See chart 1 and 2 together)
Think of it as a strategy to win a marathon. You don’t need to be the fastest runner in every lap to win a marathon.
To conclude, if any new equity portfolio is outperforming in the last one year it calls for investigation! Is it due to too much concentration risk? Is it constructed on the basis of a negative equity market outlook?